SOURCE:
Further evidence has emerged that climate models are useless for the purpose of forecasting future temperature rises.
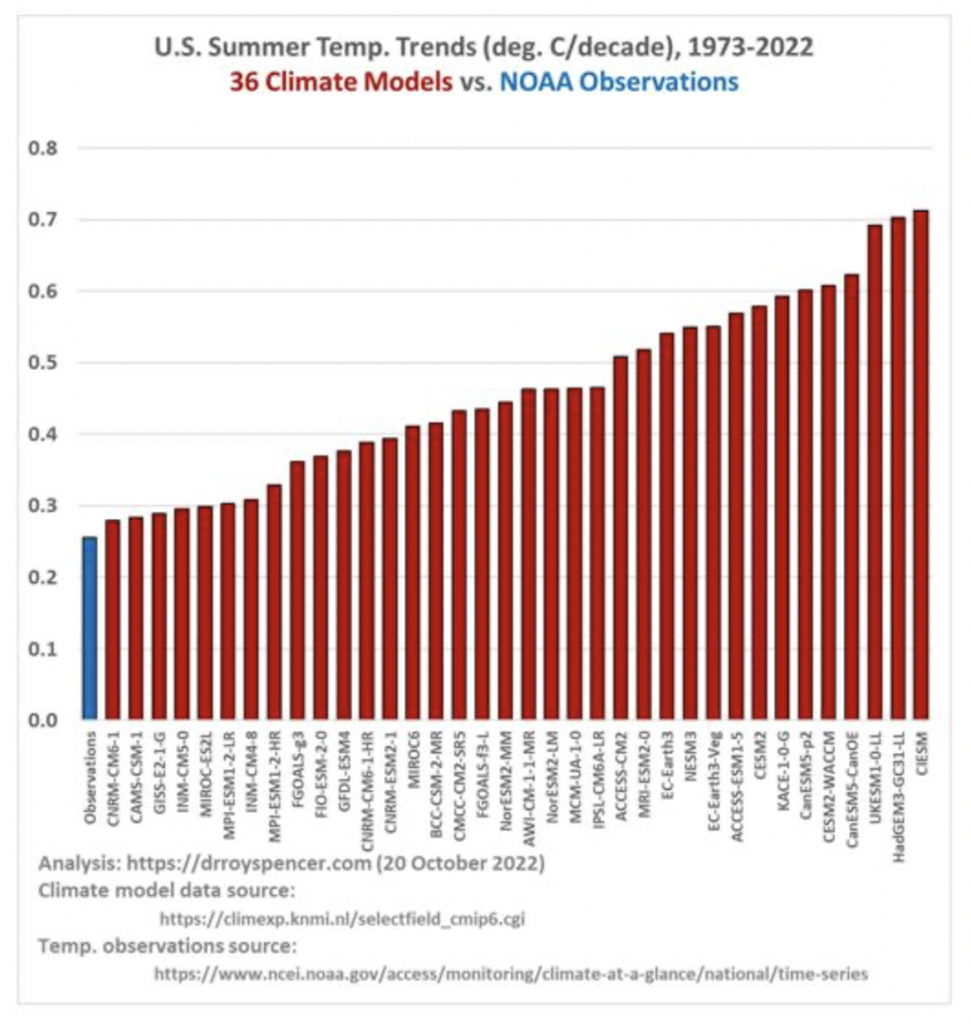
A recent survey using American summer temperatures (June, July, August) over the last 50 years, found that 36 major climate models showed nearly twice the warming rate observed by the surface temperature measurements recorded by the National Oceanic and Atmospheric Administration (NOAA). At the high end, a number of models forecast warming nearly three times greater than observed data show (blue bar below).

The research was carried out by Dr. Roy Spencer, the principal research scientist at the University of Alabama in Huntsville, and the compiler of the UAH monthly satellite temperature record.
He says that the importance of his findings should be obvious. “Given that U.S. energy policy depends upon the predictions from these models, their tendency to produce too much warming (and likely also warming-associated climate change) should be factored into energy policy planning,” he said.
But he doubted it was being ”given the climate change exaggerations routinely promoted by environment groups, anti-oil advocates, the media, politicians, and most government agencies”.
The Spencer work follows recent research published by Professor Nicola Scafetta of the University of Naples. He found that almost all the global temperature forecasts produced by models between 1980-2021 were excessive, some extremely so, compared with the accurate satellite record.
One of the reasons given as to why there’s no climate emergency in the World Climate Declaration is that climate models are “not remotely plausible as global tools”.
Yet as we have seen in numerous articles in the Daily Sceptic, climate models are ubiquitous and are at the forefront of promoting the climate scares pushing the command-and-control Net Zero agenda.
They are at the heart of the pseudoscientific work that tries to ‘attribute’ single extreme weather events to long-term changes in the climate claimed supposedly caused by fossil fuels.
In simple terms, computers compare an imaginary climate without human-caused carbon dioxide with the current one full of unknown complexities, and then the modelers announce they’ve ‘proved’ the ‘climate emergency’ hypothesis. Since the outputs of these models are unfalsifiable – how can you prove that a wholly imaginary scenario is ‘false’? – the notions are no more than worthless opinions.
The results of Spencer’s work will hardly come as a great surprise, but the conclusions are almost certainly more damaging to the climate catastrophisers’ case than the figures suggest.
Spencer uses NOAA surface temperatures and, as we have seen, these are subject to ‘corruption’ from a number of causes in recent years. As Spencer notes, the NOAA figure could be an over-estimate “if increasing urban heat island effects have spuriously influenced trends over the last 50 years, and I have not made any adjustments for that”.
Earlier this year, the U.S. meteorologist Anthony Watts published his latest survey of NOAA’s nationwide weather stations. Describing the temperature record as “fatally flawed”, Watts found about 96% of US temperature stations failed to meet what NOAA itself considered to be acceptable and uncorrupted placement.
Watts defined ‘corruption’ as caused by the localised effects of urbanisation, producing heat bias because of a close proximity to asphalt, machinery and other heat-producing, heat-trapping, or heat-accentuating objects. According to Watts, data that had not been corrupted by faulty placement showed a rate of warming in the U.S. “reduced by almost a half compared to all stations”.
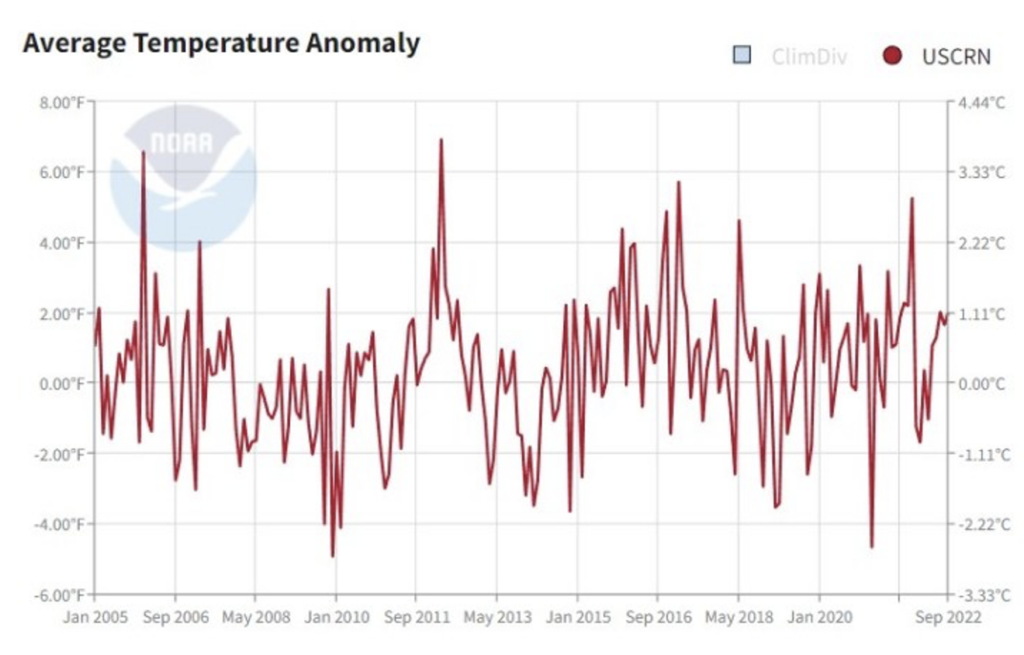
There is further substantial evidence that NOAA’s U.S. surface temperature figures are too high. In 2005, it started compiling data from a select group of 114 stations across the country that had been specifically sited away from urban development. Called the U.S. Climate Reference Network (USCRN), it was intended to aim for “superior accuracy and continuity in places that land use will not likely impact during the next five decades”.

The graph above shows the rarely referenced record up to last month. It shows oscillating temperature changes, but very little evidence to indicate a warming trend over the last 17 years.
Considering what is known about the ‘corruption’ of the NOAA’s main temperature dataset, it would be reasonable to significantly reduce the blue NOAA observational bar in Spencer’s graph. This of course provides further confirmation that the temperatures forecasts of most climate models have long lost any connection with reality.
Chris Morrison is the Daily Sceptic’s Environment Editor.