SOURCE:
storms are not intensifying, media is - by el gato malo (substack.com)
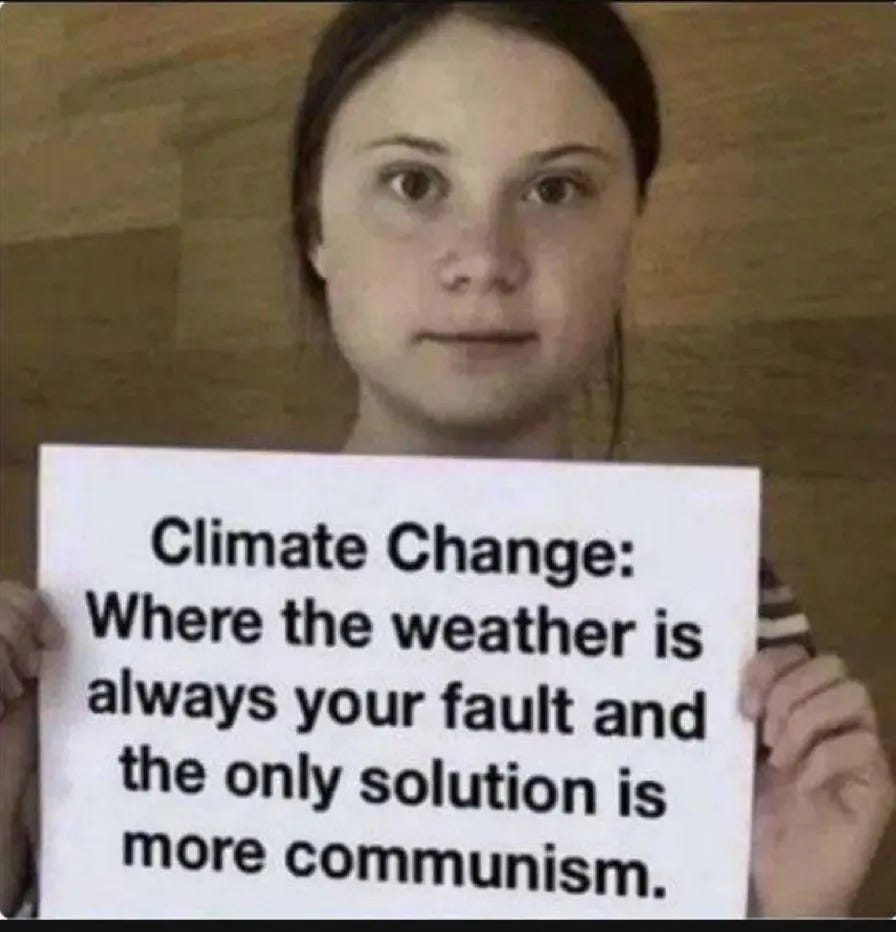
the modern media mantra appears to be “never let any sort of worrying weather go to waste!”
the desperation and devotion to “all weather is the fault of fossil fuels” has been a recurrent refrain for 50 years from back when they claimed it was causing an ice age in the 70’s through “global warming” into the now wonderfully vague “climate change” and “extreme weather” claims.
i fear we are looking at not so much a progression of science but a relentless A/B testing of talking points.
the whole thing makes for great media and great politics. you can instantly weaponize any heat wave or storm or summer melt into “we need to grab control of the global energy market and tell everyone what to do and if you don’t stop using straws we’re all gonna die!”
there will always be weather.
somewhere on earth,
it will always be bumming someone out.
it’s endlessly evergreen.

there is of course one eensy pequeño problema here, and that’s that most or all of these claims are complete nonsense and easily debunked.
i’m not going to try to wade into the whole CO2 issue here as it’s way too complex and technical, but this is one is really straightforward and simple because we have numerous objective measures by which to assess it and when we do, it becomes obvious: storms are NOT getting stronger.
you can measure storm intensity by barometric pressure. lower pressure is a stronger storm. the relationship here is basically zero. r2 = 0.0064 which means that time predicts less than 1% of variation. it only looks like an intensification trend because of the (somewhat arbitrary) dashed line.
you can see ian in red. it was a strong storm, but far from a high intensity outlier. i’m eyeballing, but i’d guess it’s about 1 std deviation which is, of course, kind of, well, standard.
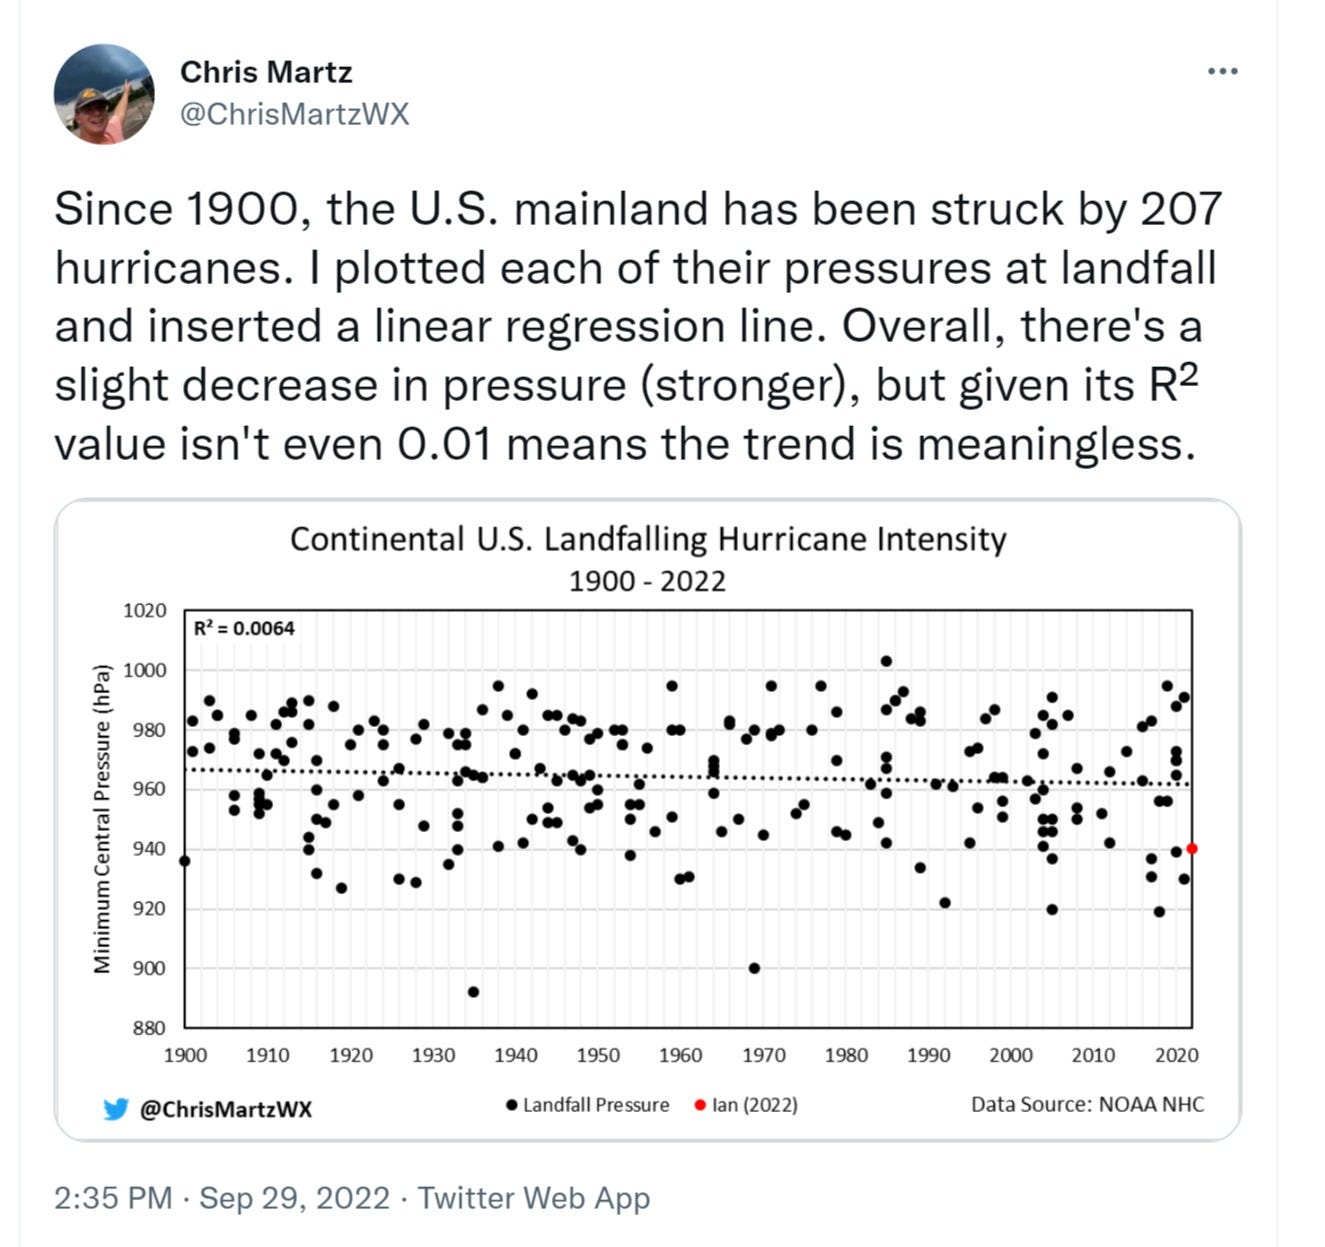
the advantage of this measure is that the series goes back a century because barometers have long been common. it does have some limitations as it does not measure other relevant factors like size and duration.
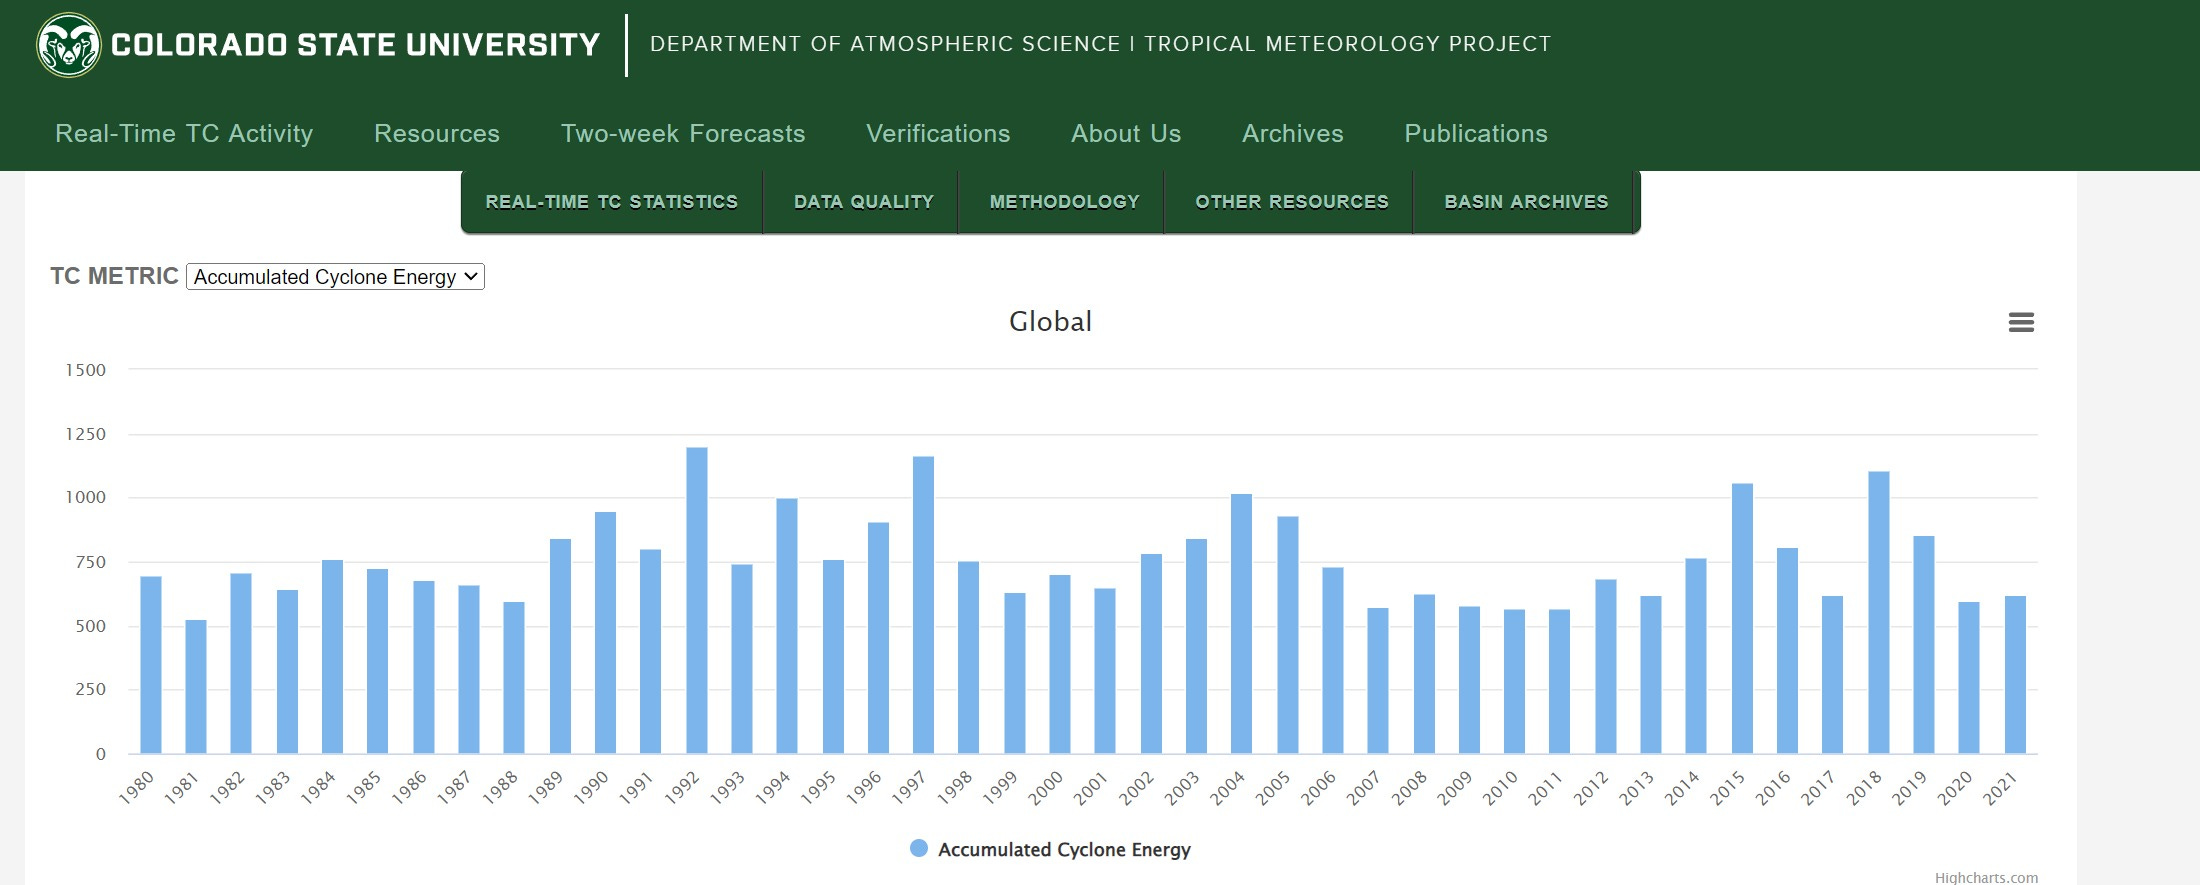
but we can, in the satellite age, measure those. that measure is called “accumulated cyclonic energy” (ACE) which is, quite literally, a measure of all the storm energy recorded in a year. this is the gold standard for assessing this issue.
probably the leading aggregator of this data is the department of atmospheric science at colorado state university. you can access their data HERE.
it goes back to 1980 when orbital tracking of storms became available. as can be seen, there is no trend in ACE per year.
i did not want to be accused of drawing an arbitrary line or correlation, so i dropped their data into excel:
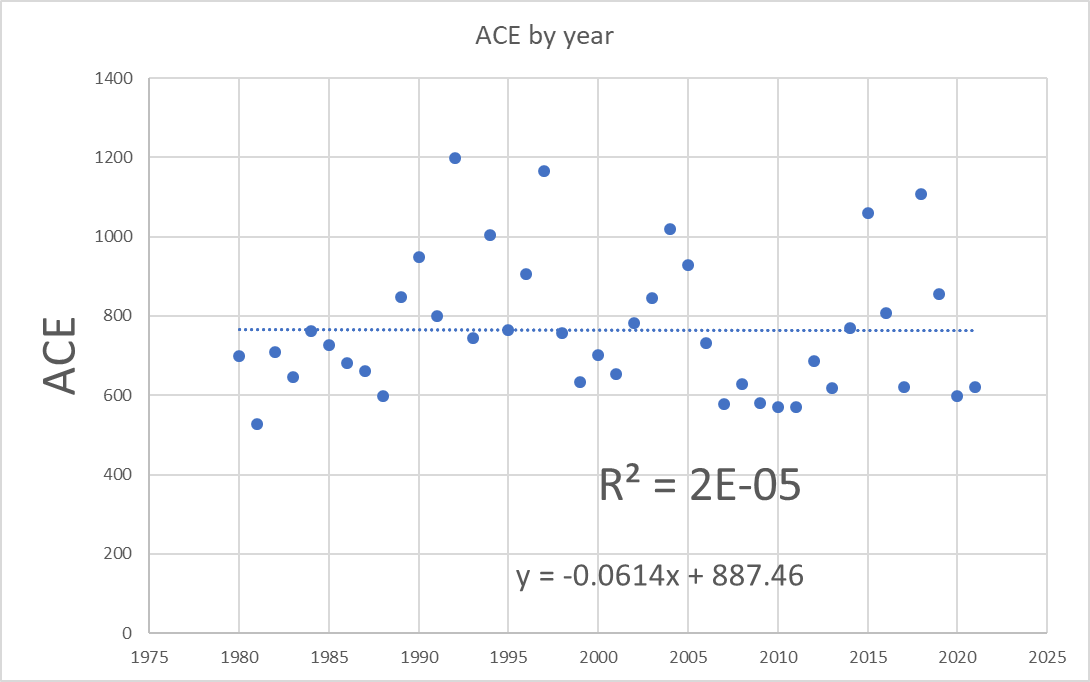
for those not accustomed to scientific notation 2e-05 = 2 x 10-5 = 0.00002. so the coefficient of determination is indistinguishable from 0. that is the very definition of “no trend” (though the utterly miniscule trend that emerges is actually negative).
this “gold standard” data is not trending.
ideas like measuring “dollar damage” are deeply fraught and mostly just measure inflation, population, and propensity to live in storm zones due to insurance and stronger construction. it has little to do with the storms themselves.
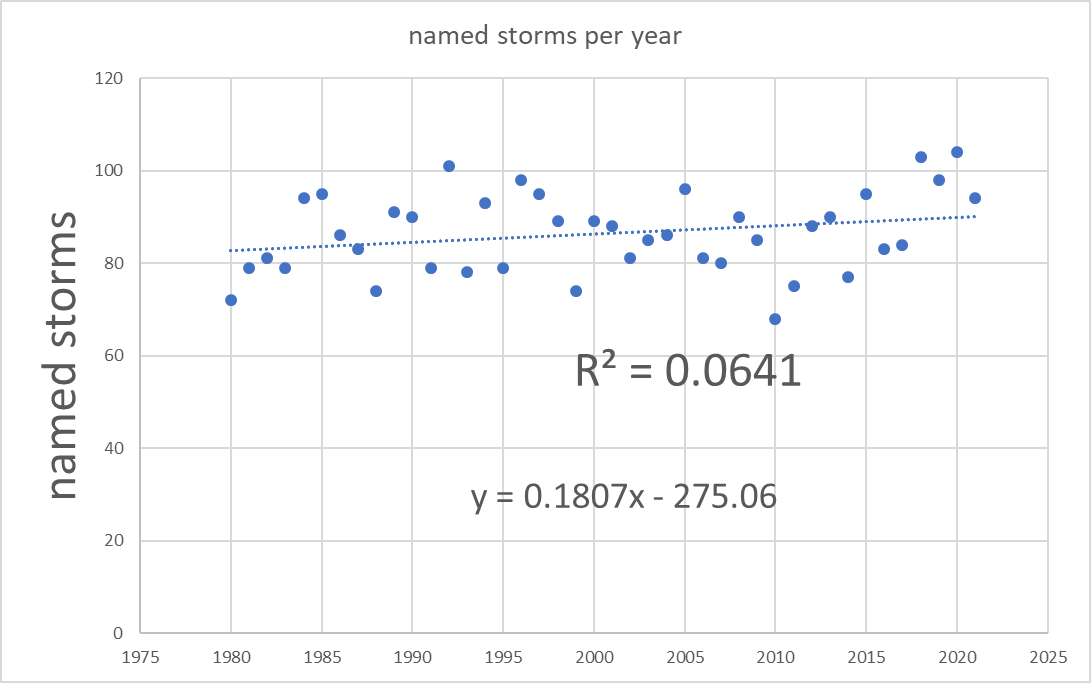
we see a small rise in “named storms” which some like to seize on as “proof of more extreme weather” but this is more likely a function of lower standards for naming one.
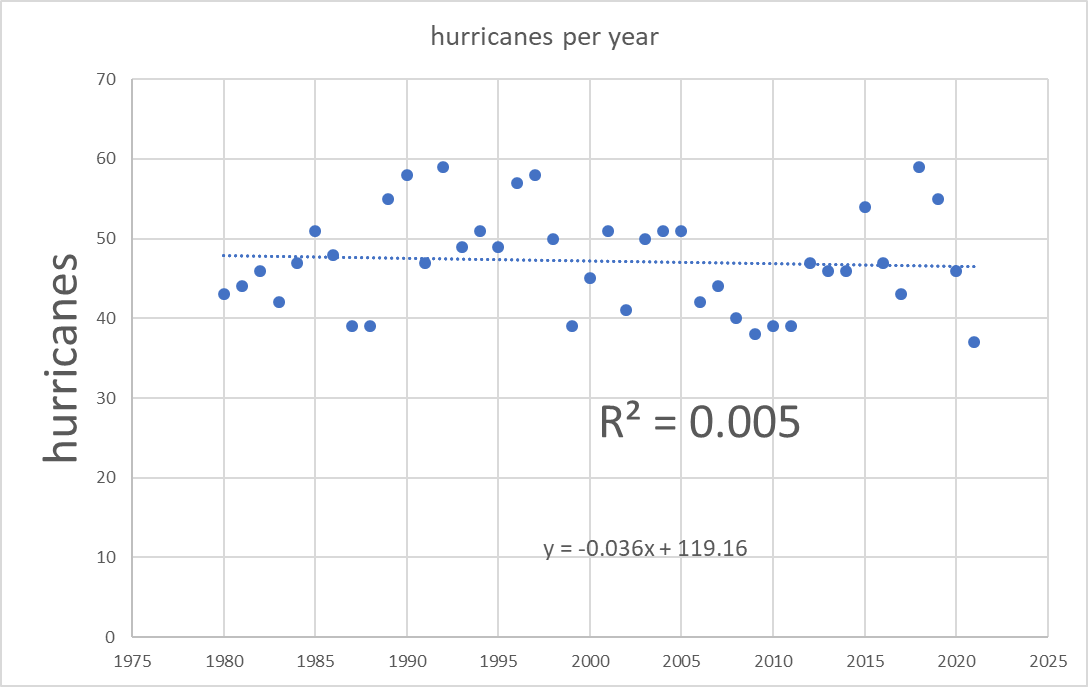
the trend in hurricanes is actually slightly down though temporal correlation is basically zero and the trend has no material meaning.
i stopped plotting these because they all looked so similar, but here is “cat 3 + hurricanes” from the colorado site because someone is doubtless gonna ask.

and cat3+ hurricane days
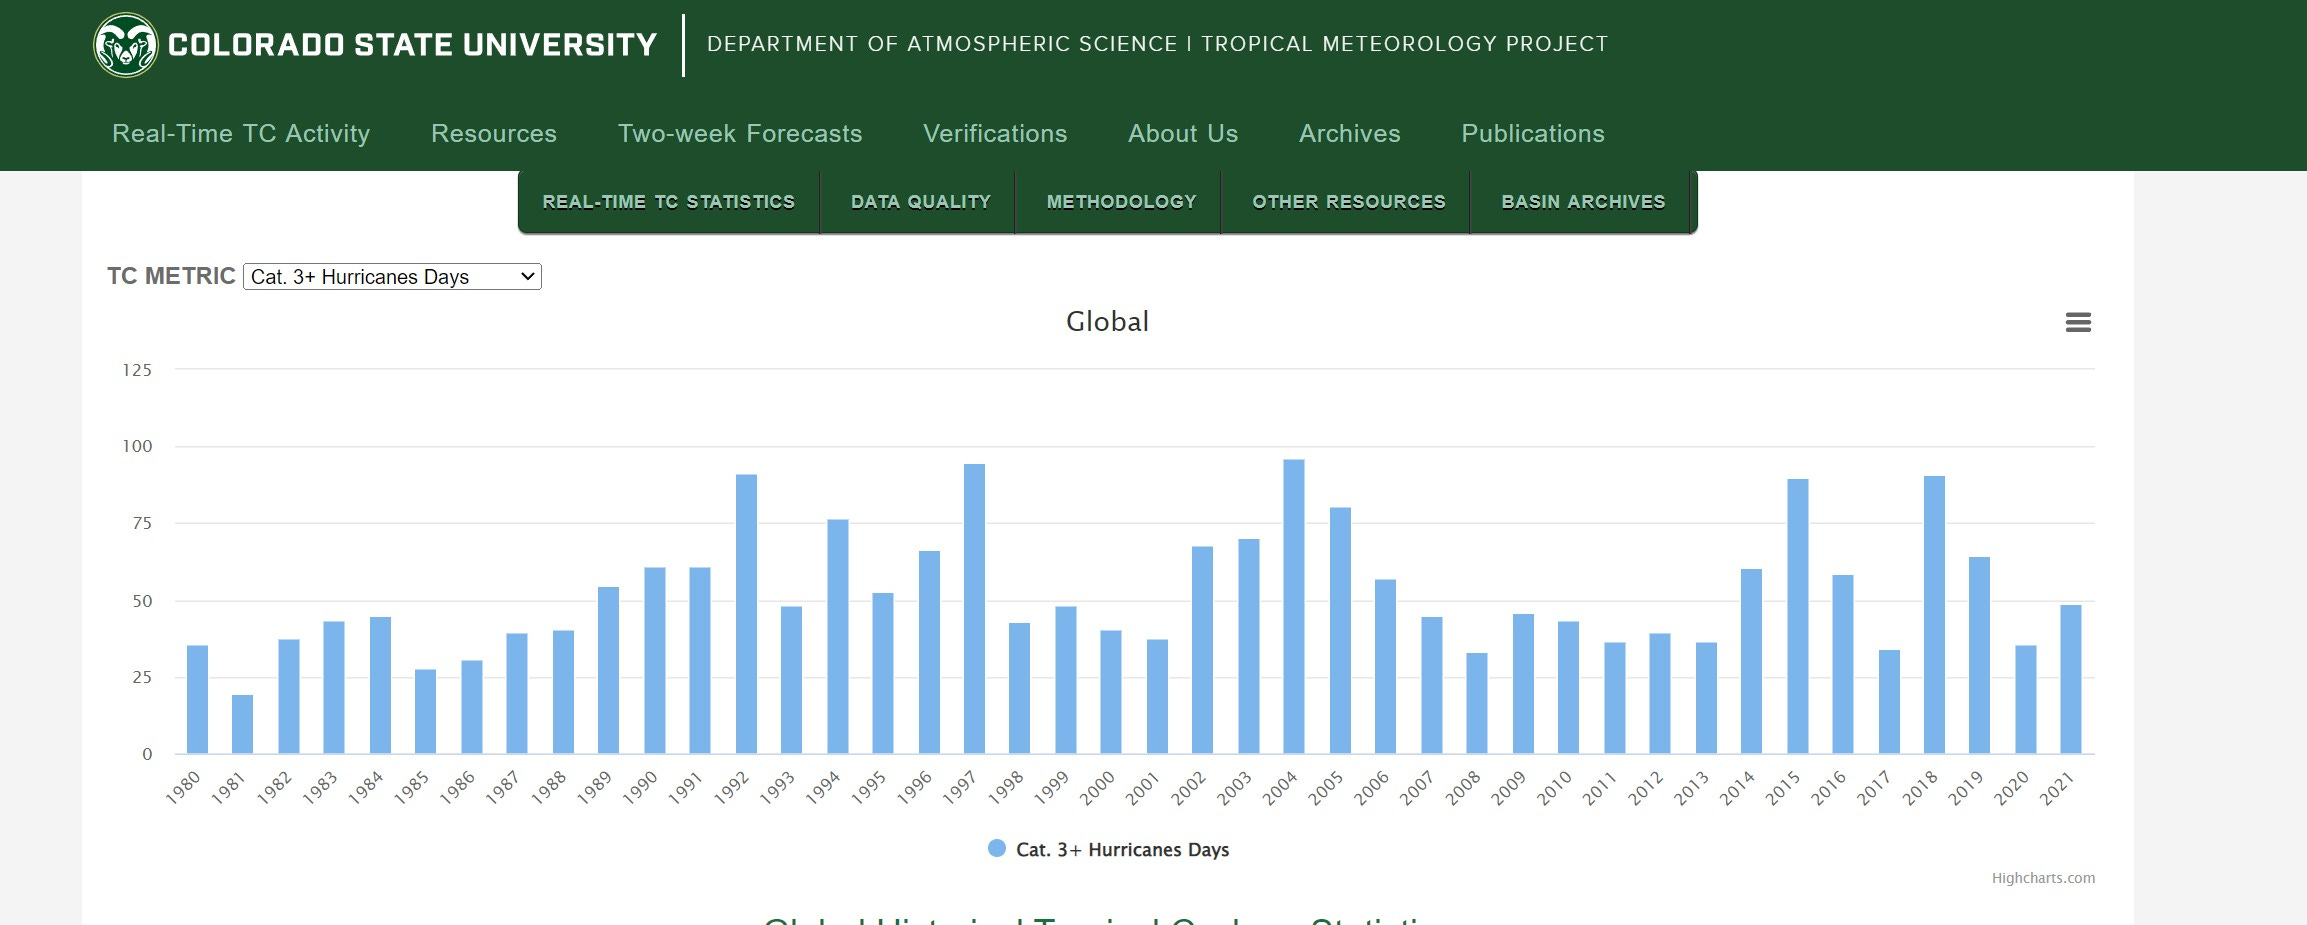
really not much in the way of trends there and 2022 is going to be a low year.
worth noting is that there does seems to be some sinusoidal cyclicality in this data around shifts in the big ocean currents (atlantic multidecadal oscillation, pacific decadal oscillation) as they flip form warm to cold parts of their cycle,
but this data gets A LOT less trustworthy and less inclusive before the satellite era as it relied on things like “boats/airplanes that happened to be in the area” to measure offshore storms so i’d avoid trying to draw trendlines that cross the 1979-80 move to monitoring from space. this is a data splice of unlike sourcing.

but the bottom line is this: the evidence that there has been no trend in hurricane frequency, intensity, and accumulated cyclonic intensity for over 50 years is extremely strong, objective, and obvious.
”STUDIES” that make sensational claims about “climate change added 10% to ian’s rainfall” are just the latest set of made up tropes to create “weather fear” by using (wait for it) models with assumed parameters to validate the parameter assumptions.
there is no data here, just “if i tell the computer that X causes Y in my model, my model proves that X causes Y.” there is nothing real to see here.
like the hurri-claims, it’s just another example of the endless and ever shifting game of whack a mole bespoke science created to support political movements in exchange for grant money and access to ideologically curated journal publication.
and the minute they wear out one vector of claims, they launch another.
the fun part about these lines of argument is that they are s contrary to obvious, checkable facts that i think they blow up in the faces of the makers. sure, the choir of aligned opinion loves it, but the center seems to really be catching on to just how willing these folks are to lie in order to get their way.
and it makes them wonder: “if they’ll lie about this, what else are they lying about?”
and that’s how the “tyranny of experts” ends.
just remember, all we’re really hearing is this: