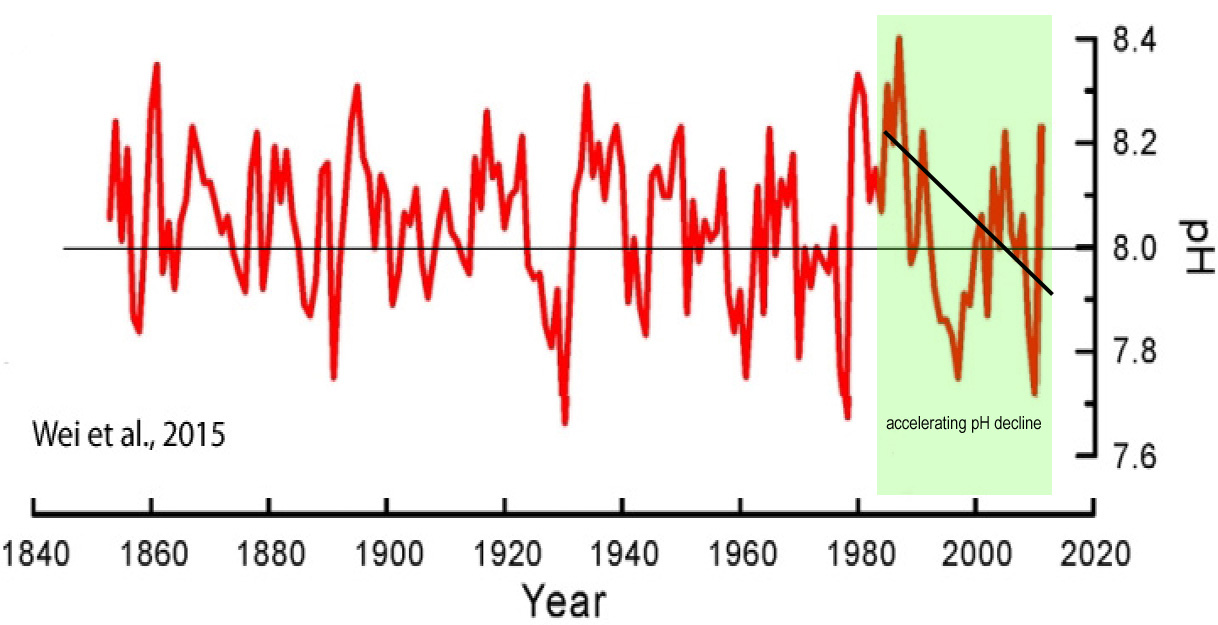
A very small
declining trend
in ocean pH values
( aka "acidification" )
occurred
before 1930
( before man made
CO2 emissions
began rising ).
Since 1930,
seawater pH trends
have been steady
( meaning sharply rising CO2 levels
had no obvious effect
on ocean “acidification” ).
Scaremongers claim a long-term decline
in pH, or “acidification”, is now occurring,
far too rapidly for the oceanic biosphere
to adapt.
Some alarmists claims pH changes
in the last few hundred years
are extreme.
They have no data to support
that bogus claim.
Measurements are
very difficult because
ocean pH values
naturally fluctuate
up and down
by up to 0.6 U
within a span of a decade,
with an overall range
between 7.66 and 8.40.
Many highly cited
pH trend studies
choose a starting point
from the recent decades,
rather than from
a long-term record.
Dore et al. (2009),
for example,
chose 1988.
Using recent decades has the effect
of illustrating that pH decline,
or “acidification”, coincides with
dramatically rising CO2 emissions.
An entirely different
pattern emerges
if we use 1930,
rather than
more recent decades,
as the starting point
for pH trend detection.
The long-term
decline in pH
can mostly be found
in the decades
prior to the 1930s,
when steep increases
in CO2 emissions
were NOT occurring.
The post-1930s period
suggests a slightly
rising pH trend
( meaning more alkaline,
or less acidic ).


https://web.archive.org/web/20170110095943/http://www.sanctuarymonitoring.org/regional_docs/monitoring_projects/100240_167.pdf
Monterey Bay Aquarium
Incoming Seawater Study,
1995 – 2009
Summary and Conclusion:
1.
The pH range was 7.75 to 8.15
2.
Readings oscillate
up and down
seemingly at random,
with a hint of possible
seasonable variability.
3.
The data exhibit NO TREND
to higher or lower pH
(first data point is 7.75
and final is 7.9)
4.
The error bars
massively dwarf
alleged changes
caused to oceans
by man.
I.e., no claim
of altered ocean pH
can legitimately
be made.