NOTE:
I highly recommend Mr. May's website to readers.
The articles are consistently good and the quantity of good articles so far in March 2022 is hard to believe, coming from one author. I rarely recommend other websites because they lack consistency. This one is a rare exception.
https://andymaypetrophysicist.com/climate-blog/
Concerning the UAH global average temperature compilation: This blog has always favored UAH data, and warned readers that global averages were not trustworthy before the use of weather satellites in 1979.
Just as important: Predictions of the future global average temperature, which I consider to be climate astrology, are NOT simple extrapolations of the global warming trend from 1975 through 2020. Otherwise, differences between various current global average temperature compilations would be much more important.
Never forget that climate predictions are for a global warming rate 2x to 3x faster than the cherry picked 1975 to 2020 period. I say "cherry picked" because CO2 emissions did not start in 1975. There were growing CO2 emissions from 1940 to 1975, with NO global warming. That fact is conveniently forgotten.
Actually, 1940 to 1975 was originally measured as a significant global cooling period. But that fact was "inconvenient" for the 'CO2 causes dangerous global warming' narrative, so climate reality was gradually "adjusted away" (aka Science fraud by government bureaucrats with science degrees).
Ye Editor
FULL ARTICLE HERE:
https://andymaypetrophysicist.com/2022/03/25/uah-v-rss/
Carefully Selected Quotes, by Ye Editor
"CONCLUSION (minimal editing)
Satellite temperature measurements are more useful than surface measurements in climate studies for several reasons:
The data used is all collected the same way and with similar instruments.
More atmospheric mass is included.
The temperature measured is mostly above the chaotic boundary layer of the atmosphere and is more stable.
Radiosonde data is available as an independent check on the calculations.
... the UAH temperature calculations correlate best with the radiosonde data, suggesting that it is the best satellite temperature record.
The RSS decision to include the clearly flawed NOAA-14 data in their calculations is highly questionable when the clearly superior NOAA-15 data is available for the period in question.
NOAA-15 develops problems later and both RSS and UAH drop it early, but NOAA-STAR continues to use it for many more years.
Since the UAH temperature record is probably the superior record, it is reasonable to estimate TCR (transient climate sensitivity to a CO2 level doubling. Ye Editor) from it.
Christy and McNider did this and derived a TCR of 1.1°C/2xCO2.
While this value is much less than the AR6, AR5 and AR4 value of 1.8°C/2xCO2 (AR6: 1.2 to 2.4),[5] it falls in line with estimates from Lewis and Curry, Lindzen and Choi, Alexander Otto and colleagues, and others.[6]
A reduction of 39% in TCR is significant, particularly since Christy, et al.’s estimate falls below both the AR6 likely range (1.4 to 2.2) and their very likely range (1.2 to 2.4).[7]
It seems very likely to me that AR6 is deliberately ignoring valid analysis and data to sell their political agenda.
DETAILS (highly edited)
" ... Comparisons of the satellite datasets are difficult, because while they share the same data, they use very different procedures to produce their respective temperature records.
In particular, the UAH procedure is quite different from the other three.
While the traditional NOAA dataset is called “STAR,” they now have a new one, called RMTMT for the middle troposphere that we will discuss near the end of the post.
... Nearly all radiosonde records are over land, so comparisons to weather reanalysis datasets were also made since warming rates are different over land and ocean.
... In every comparison, both globally and for the tropics, the UAH satellite temperature record correlated to the radiosondes best.
In addition, the UAH global temperature trend is lower than the trends of the other datasets from 1979 to 2015 globally and for the tropics.
The radiosonde data is not perfect, it has erroneous data as well, but it is independent of the satellite records and provides a neutral, unbiased check on the various methods of processing the satellite data.
There is no such check for the various surface temperature datasets, they all share the same data and mostly use the same methods to process it.
One of the reasons that UAH has a lower warming trend than the other datasets is UAH has corrected clearly spurious data in the older NOAA-11 to NOAA-14 satellite instruments and the other datasets have not.
... Figure 1. The correlation of the three global satellite datasets and radiosonde temperatures. The solid bars include all radiosondes, unadjusted. The stippled bars only use radiosondes that correlate well with the respective satellite dataset. A higher correlation is better, the UAH dataset correlates with the radiosondes better than the others. Source: (Christy, Spencer, Braswell, & Junod, 2018).
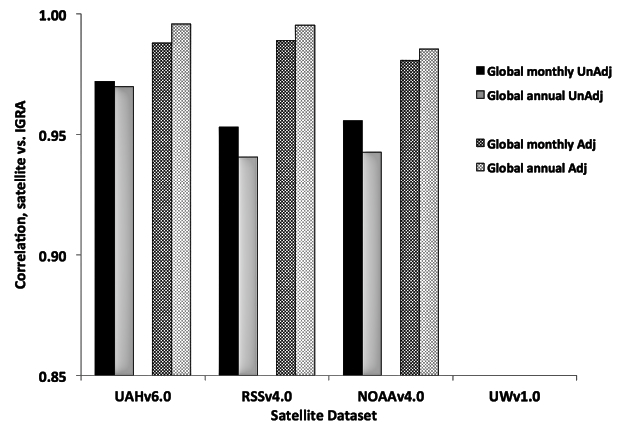
Figure 2 compares the temperature trends from the IGRA radiosondes to the global satellite datasets.
The trend of the unadjusted radiosonde data, from 1979 to 2015, is shown in gray. The satellite data, for the radiosonde locations, is shown in green.
The adjusted radiosonde data is shown in red, and the full global grid trend is shown in pink.
Figure 2. A comparison of warming trends from 1979 to 2015 for the radiosonde data and the three global satellites. Source CSBJ18.

The better match applies both to the adjusted data and the unadjusted data. At the radiosonde locations, the UAH trend is within 0.01°C/decade of the unadjusted radiosonde trend.
The RSS and NOAA datasets show much more warming.
The references can be downloaded here"
https://andymaypetrophysicist.com/wp-content/uploads/2022/03/UAH_RSS_Works-Cited.pdf