SUMMARY:
A report by the World Meteorological
Organization, a parent organization
of the IPCC, had a map showing
a surface warming of the Antarctic
where there are no thermometers
and where satellite data shows cooling.
Now, NASA’s Goddard Institute
on Space Studies (NASA-GISS)
has done the same.
The visualization of NASA’s
global temperature record
shows warming where
there are no thermometers.
Here's some reality:
Not one Antarctica
coastal weather station
shows warming,
with most
showing cooling.
Antarctica is where the opposite
of the predicted warming happened,
except for local volcanic activity
beneath some parts of the
Antarctic ice shelf, which is not
a signature of greenhouse warming.
DETAILS:
The Antarctica sea ice extent has had
an upward trend over the past 40 years,
suggesting the general area has been cooling:
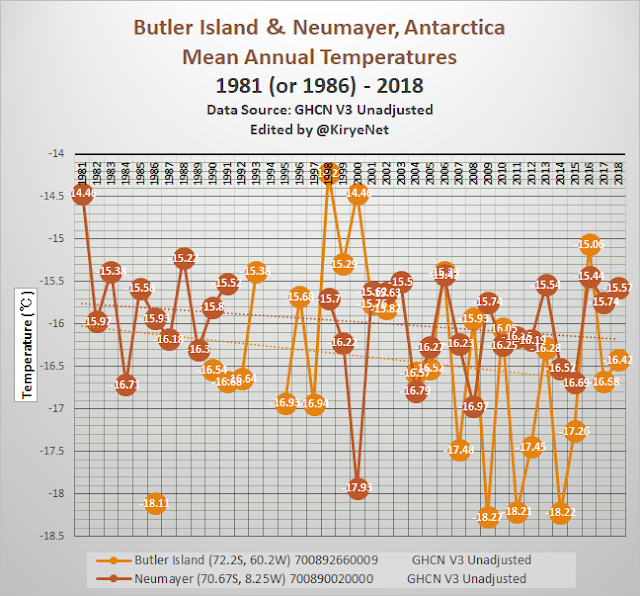
Butler Island and Neumayer
-- Both show cooling
( a downtrend ):
Halley
-- Cooling
( downtrend since 1956 ):
Syowa and Casey
-- Japan operated Syowa station,
and the Australia Casey station,
show no trend since 1961:
Davis
--A flat trend
( very slight cooling ):
Zhongshan
--Cooling trend
over the past 30 years:
Mirnyl
--Statistically flat
( very slight cooling trend ) :
Dumont D’Urvi and Mawson
-- Both had no
long term warming :
Novolazarevsk
The trend
has been
cooling :


