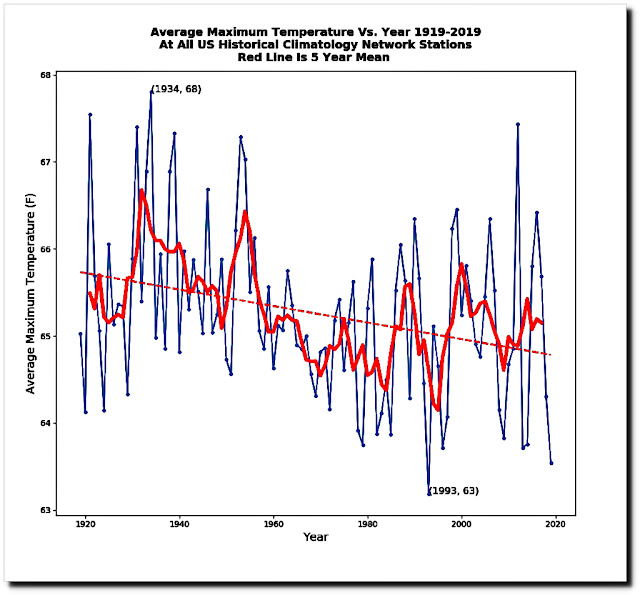
U.S. Daily Average
Maximum Temperature
( T-Max )
"Adjusted
Surface Data"
(warming trend)
presented to
the general public:
The very different
( cooling trend )
US T-Max Raw Data !
US T-Max
"Adjusted Data"
minus Raw Data:
"Adjustments"
suspiciously
match the
CO2 level:

Huge growth in percentage
of temperature numbers
that are wild guessed
(fabricated) by government
bureaucrats, since 2000
( 2019: 47% estimates / 53% "adjusted" measurements )

Subset of weather
stations that were
providing data
from 1919 to 2020,
are well distributed:
US T-Max
Raw Data
from those
continuously
operating
weather
stations:
Elevation
of those
continuously
operating
weather stations
( some have been moved )
has not changed
much over time:
Latitude
of those
continuously
operating
weather stations
( some have been moved )
has not changed
much over time:


