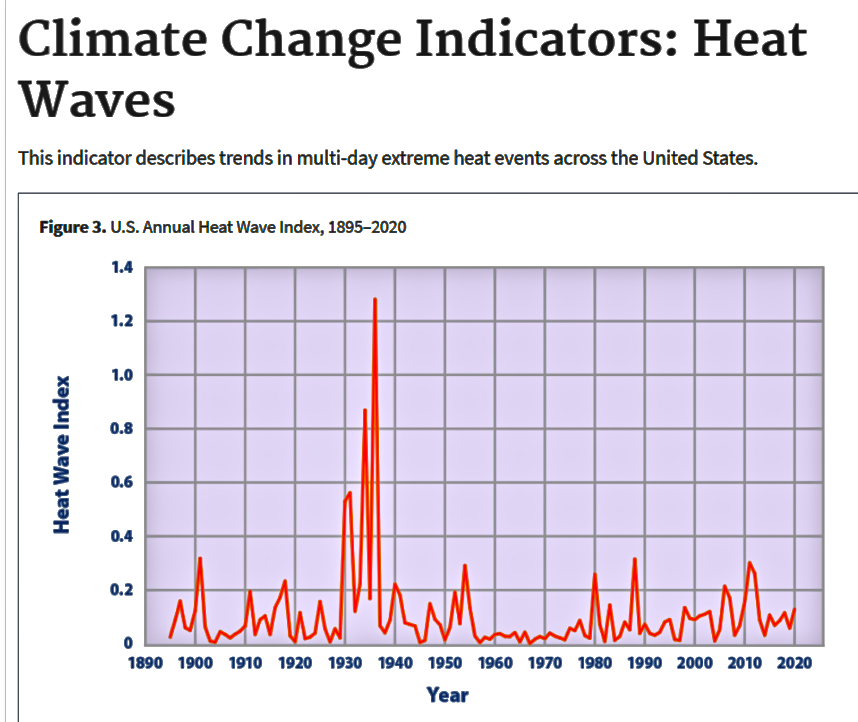
Source of chart above:
Scroll down under the Figure 1 chart that loads first, click on the "Figure 3" box under that chart -- bottom right -- and then scroll back up to see the Figure 3 chart ... which I presented above.
The EPA obviously wants people to look at the 1960 to 2020 Figure 1 chart (not shown here) because it tells a very different story than the 1895 to 2020 Figure 3 chart above.
The Figure 1 chart starts with the lowest heatwave decade of the 1960s, to create an uptrend though 2020. Government climate science is consistently junk science.
Following is an older EPA chart, with the same data, through 2015, that I had not seen during the Trump Administration:
